
Everything you'd want to know before you install.
A detailed look at how Core Web Vitals PrestaShop — CrUX tracking per template works, why we built it the way we did, and the thinking behind the features above.
§ 01
The problem with lab data
PageSpeed Insights gives you a score on a URL at a single moment, in a standardized environment. That score can be good while your real users suffer a slow page. Conversely, you can have a bad lab score while your actual customers have an excellent experience. The only metric that matters for SEO and conversion is perceived experience. And only the Chrome User Experience Report (CrUX) measures it.
§ 02
How dfcoreweb works
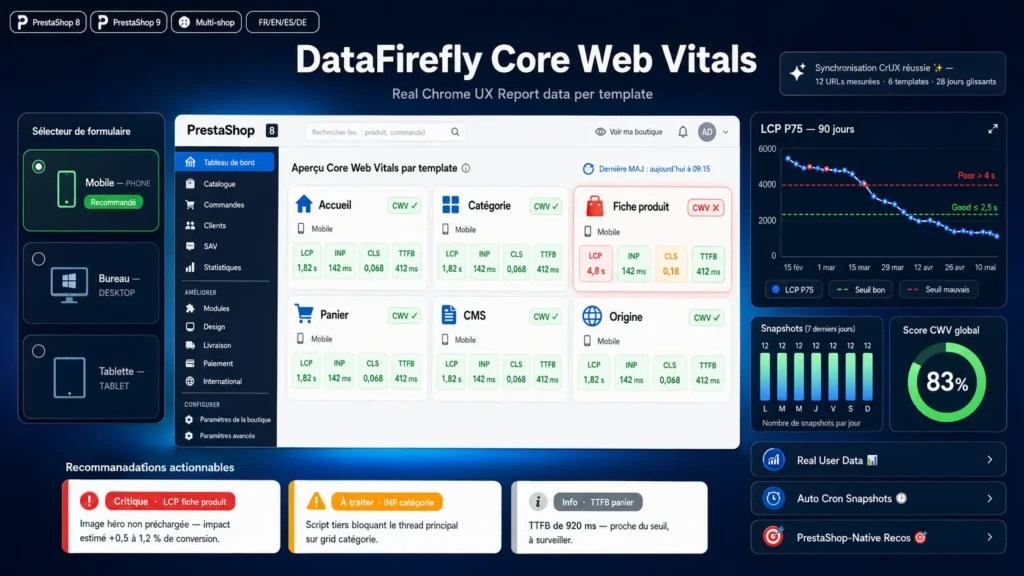
The module connects to the Chrome UX Report API (free, 30,000 requests per day) and retrieves Google's aggregated metrics over the past 28 days. Once a day is enough. The module automatically selects one representative URL for each of 6 page types: home, category, product, cart, CMS, origin. All metrics are stored locally in 3 dedicated tables. You keep the complete history, with no external dependency and no risk of losing access to your data.
§ 03
Recommendations that speak PrestaShop
When LCP drifts on a product page, dfcoreweb doesn't say « optimize the Largest Contentful Paint ». It says: is your hero image served as WebP? Have you set a preload directive on the main image? Does the image-cover element use explicit dimensions to prevent layout shift? Each recommendation is attached to the relevant template and carries a quantified estimate of the impact on conversion or engagement, calibrated on Deloitte's Milliseconds Make Millions study.
§ 04
Regression tracking and alerts
After every sync, the module compares the new value to the 7-day moving average. If a metric degrades beyond the threshold you've defined (15% by default), an HTML and text email is sent to the configured address, with delta details and a direct link to the dashboard. Valuable detection after a deployment, a theme migration or the addition of a third-party script.
§ 05
Privacy and data hosting
No customer data is sent to Google. Only the public URLs of your shop are sent to the CrUX API, and only those you have chosen to track. All measurements stay in your PrestaShop database. The Chart.js library is bundled inside the module — no external CDN calls. No tracking, no telemetry, no analytics calls on the visitor side.




There are no reviews yet.