
PrestaShop Monitoring & Alerts (DataFirefly Monitor)
Install DataFirefly Monitor 2.0.0 on PrestaShop 1.7.8 to 9, schedule the cron, set up alert channels, checked pages and rules, and understand each detection.
DataFirefly Monitor watches your PrestaShop shop continuously and warns you when it goes down, crashes, slows down or stops taking payments. It names the module most likely at fault, sends one alert per problem and tells you when everything is back to normal. This documentation covers version 2.0.0.
Installation and upgrade
Requirements
- PrestaShop 1.7.8 to 9.x, multistore and multilingual
- PHP 7.1 to 8.5, with cURL (recommended)
- A cron task every 5 minutes (recommended, see below)
Installation
- In the back office, open Modules > Module Manager, click Upload a module and send
dfmonitor-2.0.0.zip. - The module creates its tables and the tab Advanced Parameters > Monitoring & Alerts. The Configure button of the module leads straight to it.
- On installation, the shop email is used as recipient and the Payment error status is selected as failure status. PrestaShop logs written before the installation are not imported.
Upgrade from 1.x
Upload the new zip over the old one: the upgrade script adds the new columns and settings without touching your data. Error history, alerts, notifications, your settings and your cron token are kept, so the cron URL you already use keeps working.
Dashboard
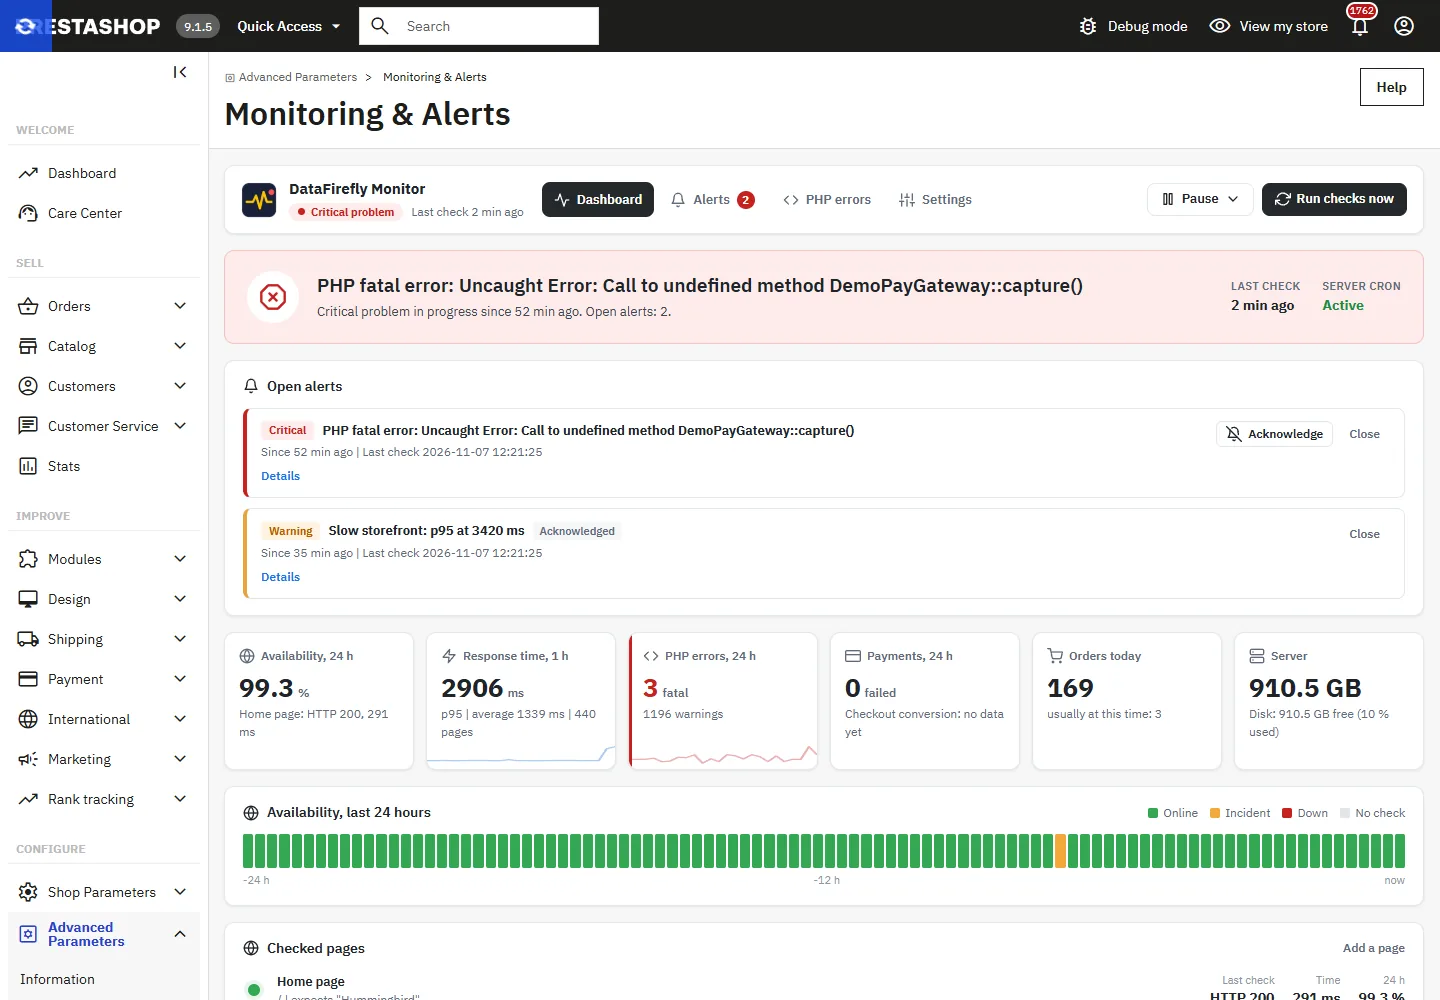
The header sums up the state of the shop in one sentence: Everything works, a warning or a critical problem. Below it you find the open alerts with their Acknowledge and Close buttons, then six indicators: availability over 24 hours, response time over 1 hour (p95), PHP errors over 24 hours, failed payments, orders today compared with the usual activity, and the server.
The availability strip shows the last 24 hours in 15-minute slots. The Checked pages card lists the home page and the extra pages with their last HTTP status, response time and availability over 24 hours.
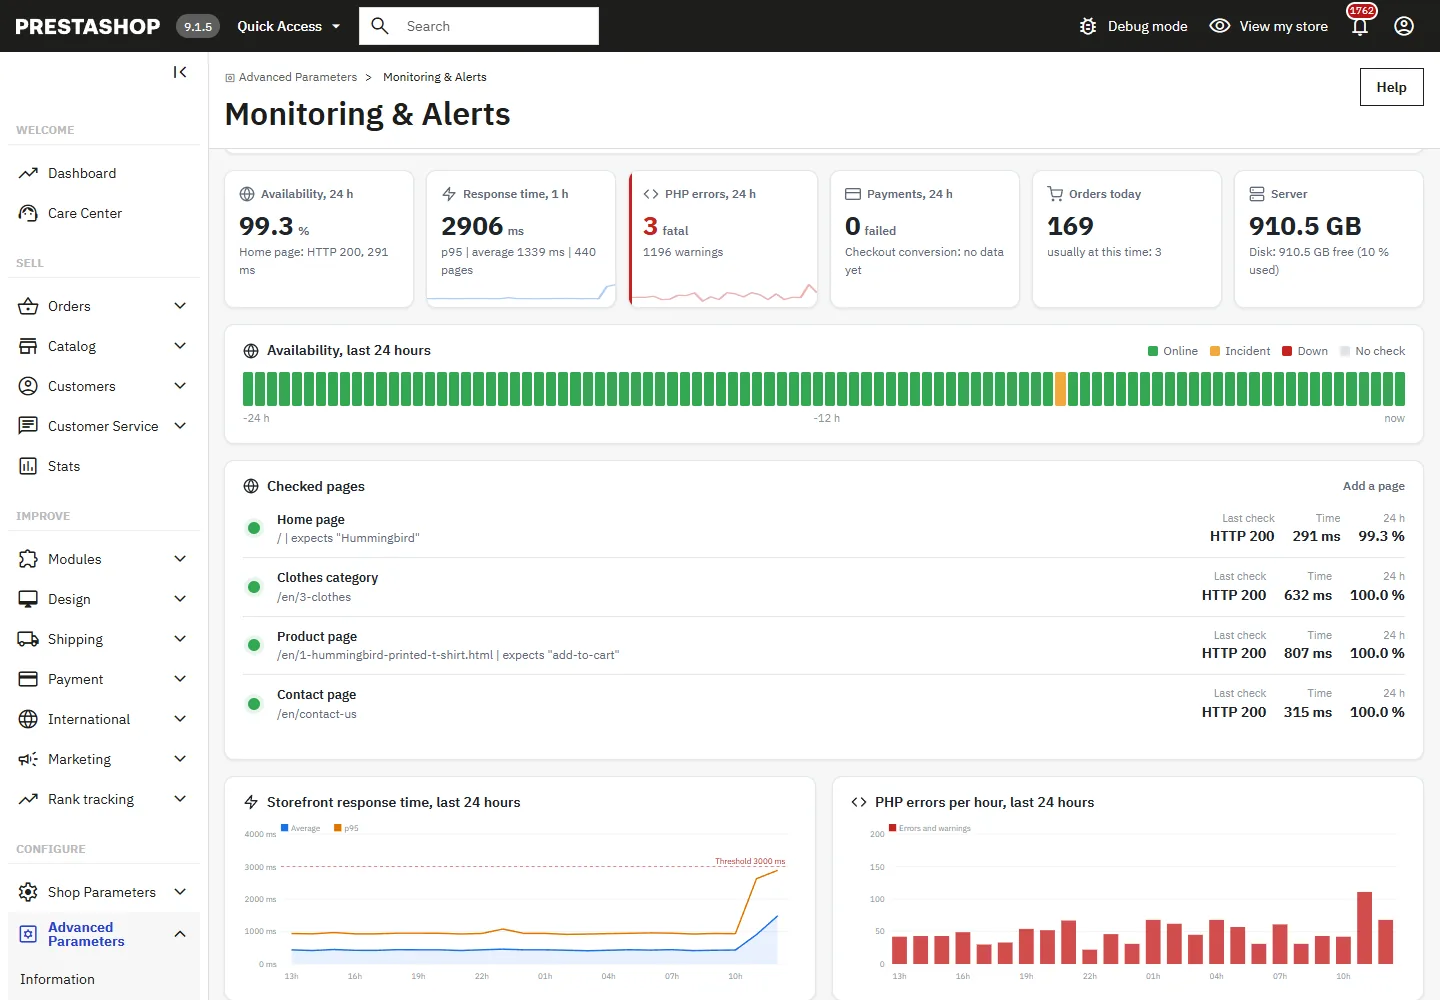
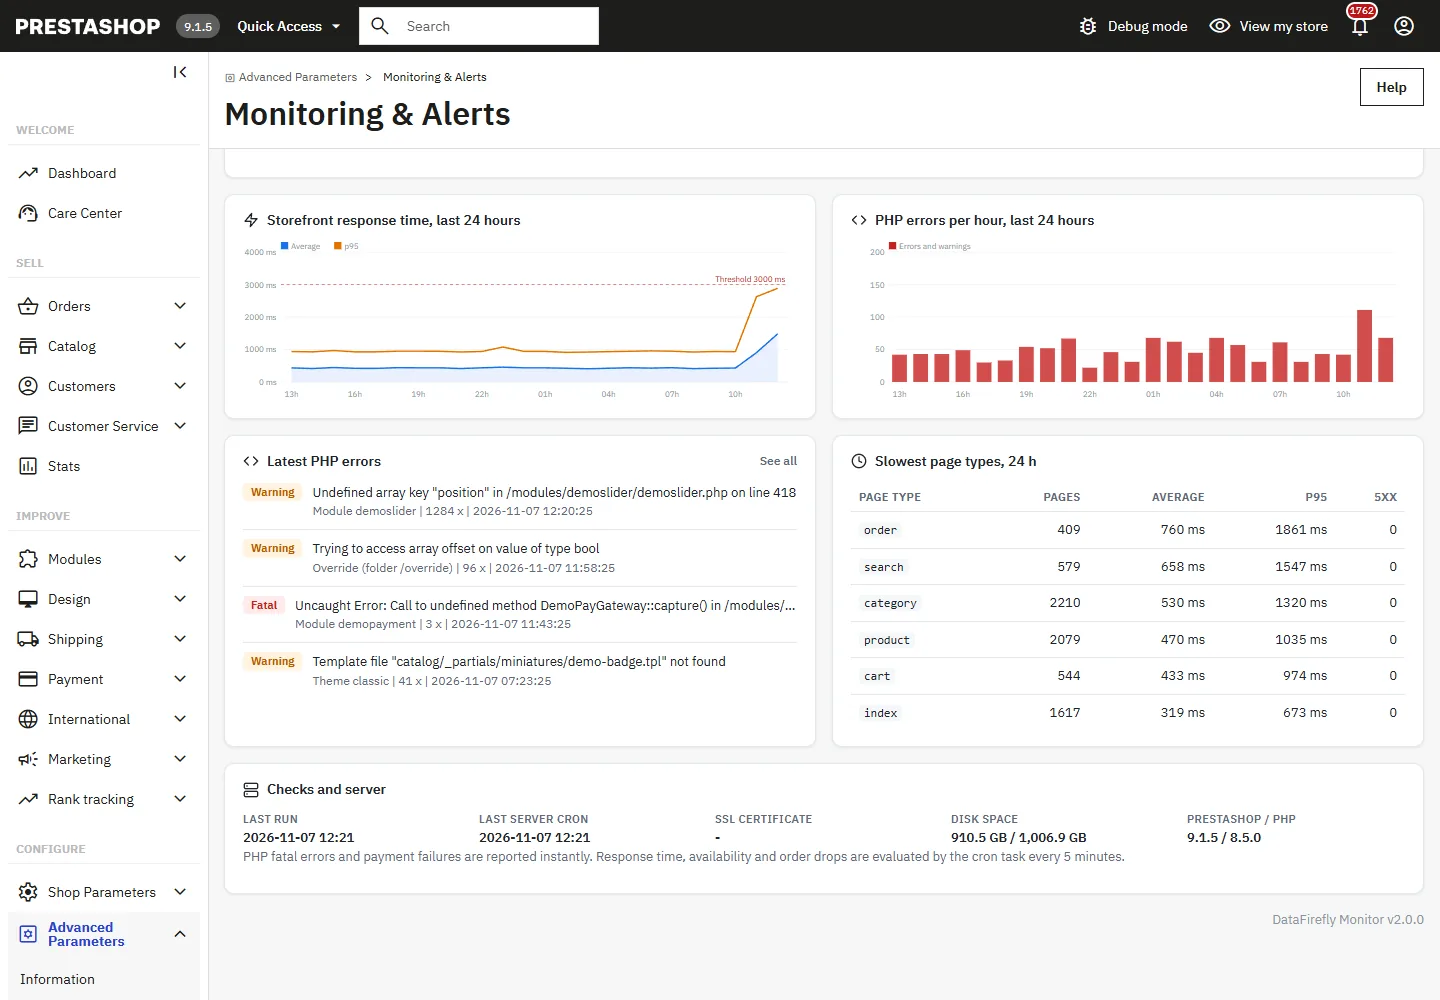
Two charts show the response time (average and p95) and the PHP errors per hour over 24 hours, followed by the latest errors and the slowest page types.
Cron task
Fatal errors and failed payments are reported in real time. Everything else (availability, response time, orders, server health, report) is evaluated by a scheduled task that should run every 5 minutes.
Server cron (recommended)
*/5 * * * * php /path/to/prestashop/modules/dfmonitor/cron.php
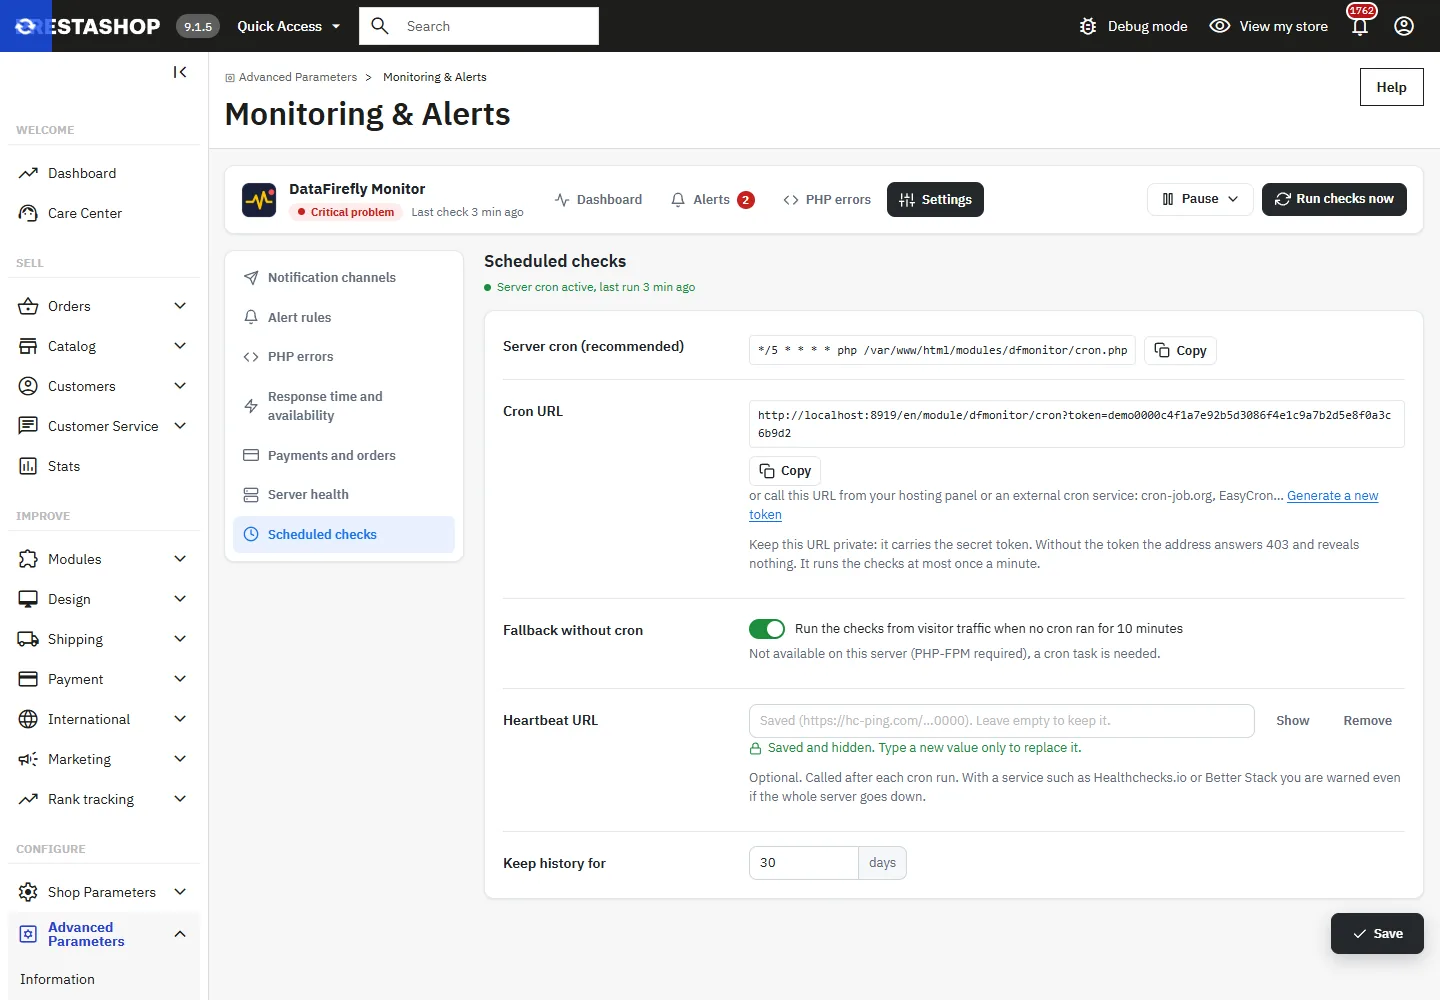
The exact command, with your server path, is shown in Settings > Scheduled checks with a Copy button. Run it as the web server user. cron.php refuses any call that does not come from the command line.
Cron by URL
If your host only allows web crons, call the URL shown in the same tab from your hosting panel or a service such as cron-job.org. The token can also be sent in the X-Dfmonitor-Token header. Without the right token the address answers 403 and reveals nothing. With it, the answer only gives the status, the duration and the number of open alerts: no path, version or error message. The checks run at most once a minute through this URL, and Generate a new token invalidates the previous one.
Without a cron
With PHP-FPM, the Fallback without cron option runs the checks from visitor traffic when no cron ran for 10 minutes, after the page has been sent. The availability check and the heartbeat do not run in this mode. With Apache mod_php, a cron is required.
External heartbeat
The module cannot report a complete server outage. Create a check on Healthchecks.io or Better Stack and paste its URL into Heartbeat URL: it is called at every cron run, and the service warns you when the calls stop.
Notification channels
Turn on as many channels as you like in Settings > Notification channels. Each channel has a minimum severity (warning and critical, or critical only) and a Save and send a test button. The result of the last delivery is shown under the channel name.
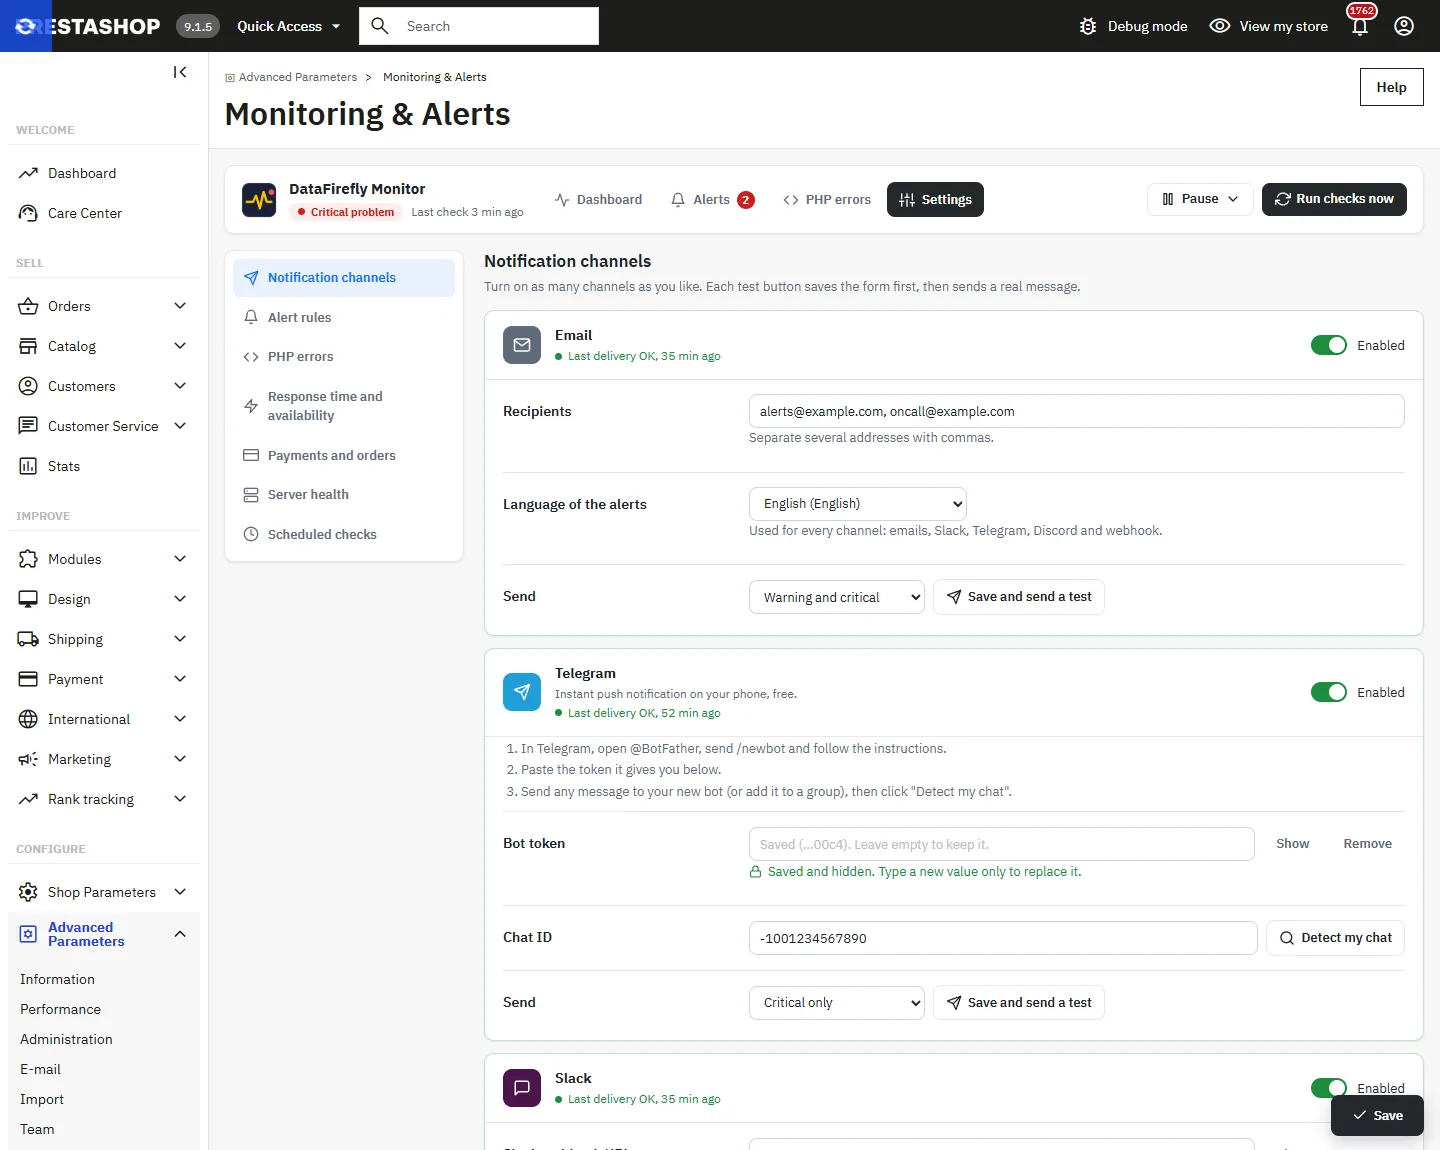
Secrets are never shown again. Once saved, the Slack and Discord webhooks, the Telegram token, the webhook URL and its secret, and the heartbeat URL are masked: the field stays empty with a hint such as https://hooks.slack.com/...7f3a. Leave it empty to keep the saved value, type a new value to replace it, or click Remove.
Enter one or more recipients separated by commas. Emails use the PrestaShop email configuration (Advanced Parameters > E-mail). The Language of the alerts applies to every channel; by default it is the shop default language. Emails are available in English, French, Spanish, German, Italian, Dutch, Polish and Portuguese.
Telegram
- In Telegram, open @BotFather, send
/newbotand follow the instructions. - Paste the token you receive into Bot token.
- Send a message to your bot, or add it to a group, then click Detect my chat: the chat ID is filled in automatically.
Slack and Discord
Slack: Apps > Incoming Webhooks > Add to Slack, choose the channel and copy the URL that starts with https://hooks.slack.com/. Discord: Server settings > Integrations > Webhooks > New webhook, then Copy webhook URL.
Webhook
For Zapier, Make, n8n, an on-call tool or your own script. A JSON POST is sent for each new alert, reminder and resolution, with the header X-DataFirefly-Event (open, repeat, resolved, test). The body contains event, alert (id, key, type, severity, title, message, occurrences, first_at, last_at, ack_url), shop and sent_at. When a signing secret is set, each request carries X-DataFirefly-Signature: sha256=…, the HMAC SHA-256 of the raw body.
For security, addresses of the private network, of the server itself and of cloud metadata services are refused, and redirects are not followed. If your tool is hosted on your own network, turn on Allow a webhook on the private network; cloud metadata addresses stay refused.
Alert rules
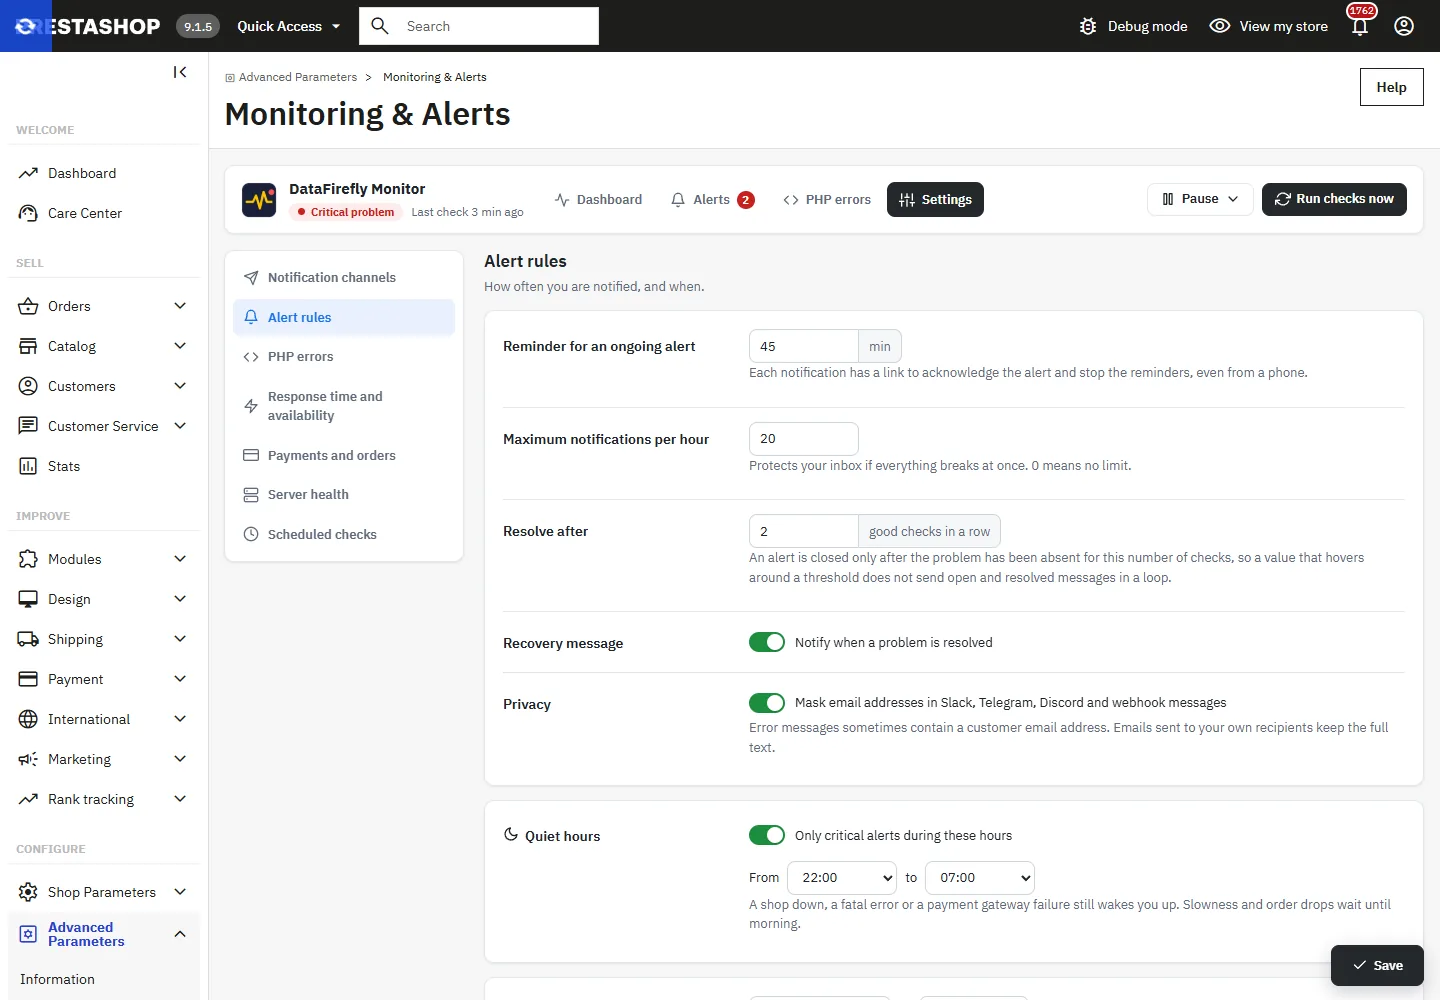
- Reminder for an ongoing alert: delay between two notifications about the same problem (60 minutes by default). A problem that gets worse, from warning to critical, is notified at once.
- Maximum notifications per hour: 20 by default, 0 for no limit. One alert sent to several channels counts once. A message held back is shown as Held back in the log and sent later.
- Resolve after: number of good checks in a row before an alert is closed (2 by default), so that a value that hovers around a threshold does not send open and resolved messages in a loop.
- Recovery message: a message is sent when a notified problem disappears.
- Privacy: email addresses found in error messages are masked in Slack, Telegram, Discord and webhook messages (on by default).
- Quiet hours: during the chosen range, only critical alerts are sent; warnings wait until the end of the range.
- Summary report by email: disabled, daily or every Monday, at the chosen hour.
Pause
The Pause button suspends notifications for 30 minutes, 2 hours, 8 hours or 24 hours, for example during an update. Problems are still detected and recorded; those still open when the pause ends are notified.
What the module detects
PHP errors
The module captures fatal errors and warnings (optionally notices and deprecations) on the storefront and, if the option is on, in the back office. Identical errors are grouped. A new fatal error triggers an immediate critical alert; it expires silently after 24 hours without a new occurrence. A spike alert is raised above 100 errors and warnings in 15 minutes (adjustable, 0 to disable). PrestaShop logs of severity 3 and 4 are imported at every cron run. Each error gets a probable origin: module, theme, override, compiled template or core; when the error is raised in the core, the first module of the call stack is used.
Response time
Response time is measured on real visits. The Share of pages measured goes from 1 to 100%; each measured page costs one database write. An alert is raised when the 95th percentile over 15 minutes exceeds the threshold (3000 ms by default), from 20 measured pages, and it is resolved once the p95 is 10% below the threshold. A critical alert is raised when more than 5% of requests end with a server error over 15 minutes, with at least 5 errors.
Availability and checked pages
At every server cron run, the module loads the home page and up to 5 pages of your choice: a category, a product, the cart, the contact page… A page is up when it answers HTTP 2xx or 3xx (after up to 3 redirects), 401 or 429. It is down when it does not answer, answers 5xx or another 4xx, misses the expected text you set, or, for the home page, is blank. After 2 failures in a row (adjustable) a critical alert opens. The check is suspended in maintenance mode.
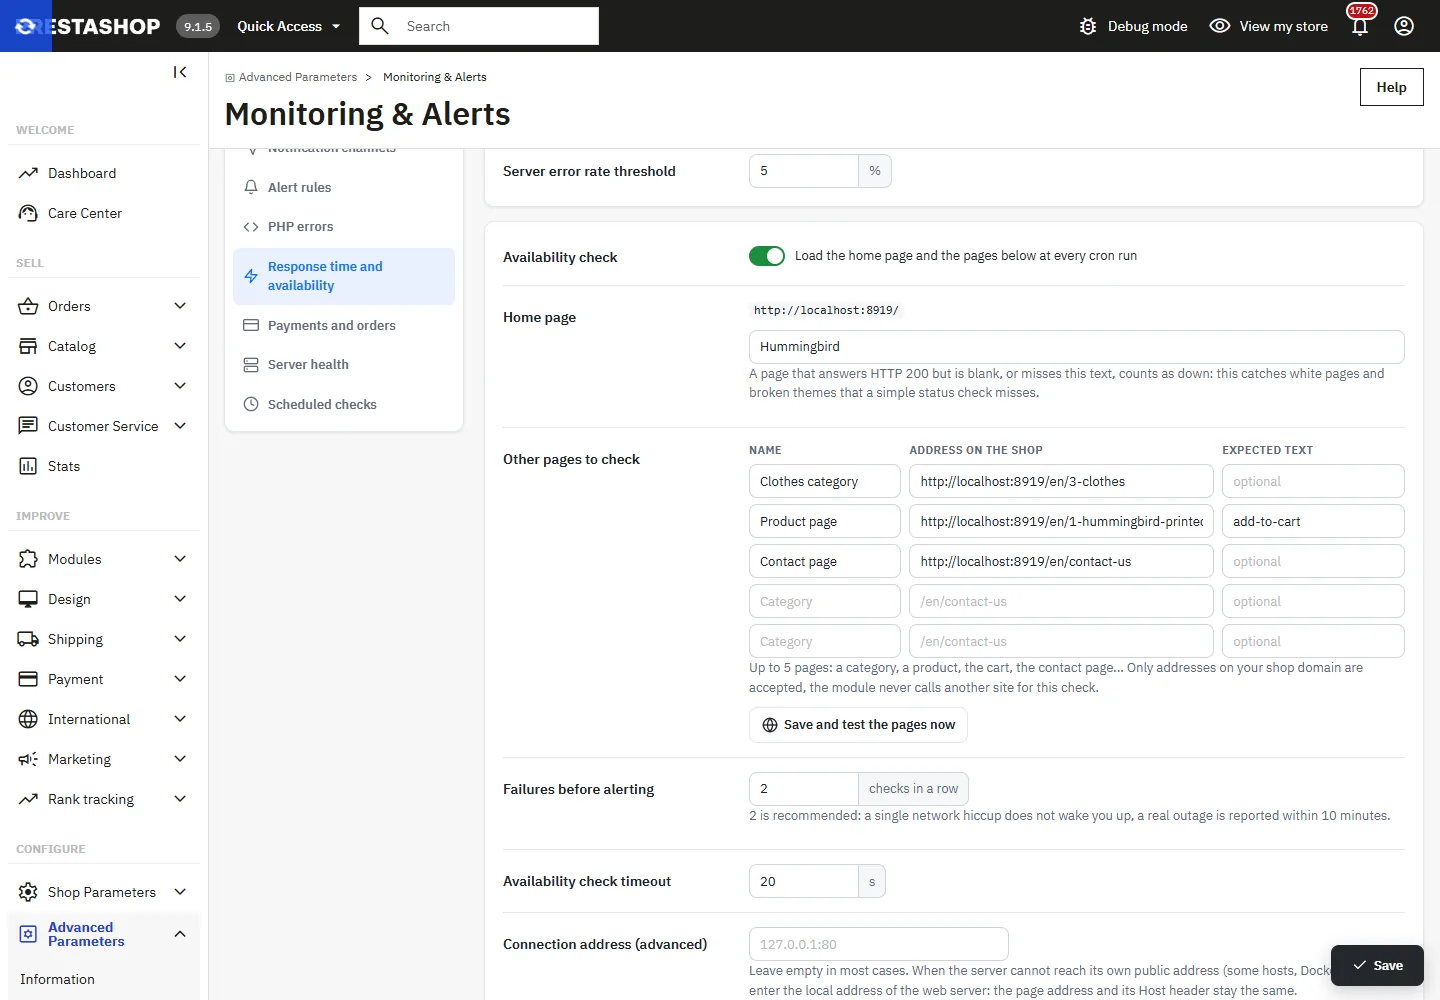
Only addresses on your shop domains are accepted: the module never calls another site for this check. Use Save and test the pages now to check them at once. If the server cannot reach its own public address (some hosts, Docker, a proxy), enter the local address of the web server in Connection address, for instance 127.0.0.1:80: the page address and its Host header stay the same.
Payments and orders
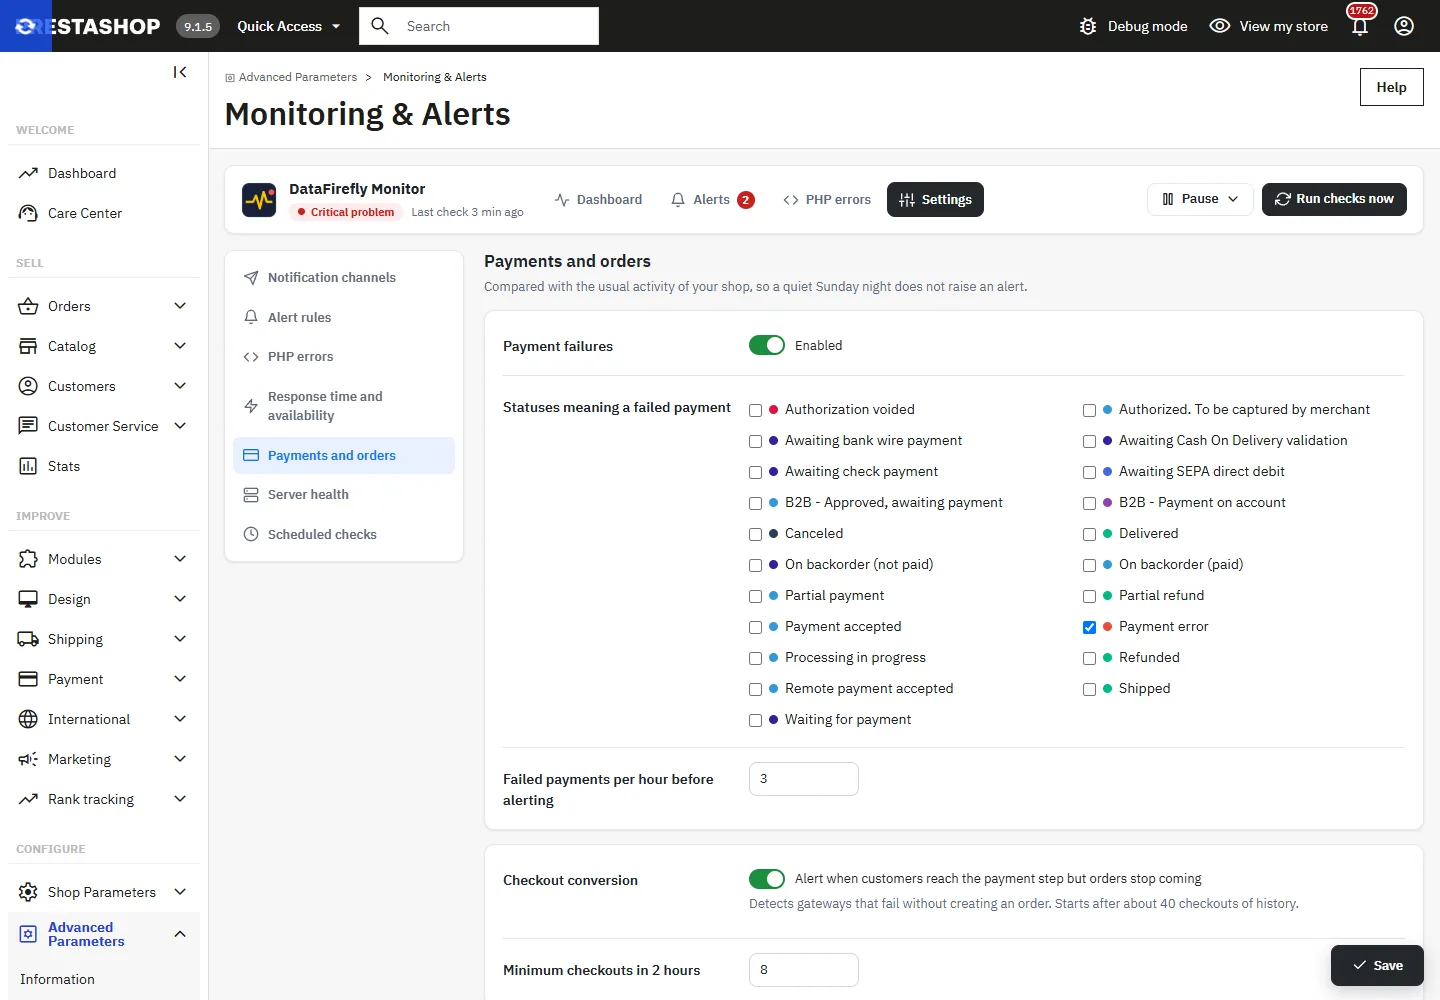
- Payment failures: orders moved to one of the selected statuses over the last hour, broken down by payment module (threshold 3 by default). The check also runs as soon as an order changes status, after the response has been sent, so it never slows down the order.
- Checkout conversion: the share of carts that reached the payment step and became orders, over a 2-hour window, compared with the usual share over 28 days. It starts after about 40 carts of history.
- Order drop: orders over the last 3 hours (adjustable) compared with the same time slot of the previous 4 weeks. Skipped when fewer than 4 orders are expected.
- Sensitivity: low, medium (recommended) or high.
Server health
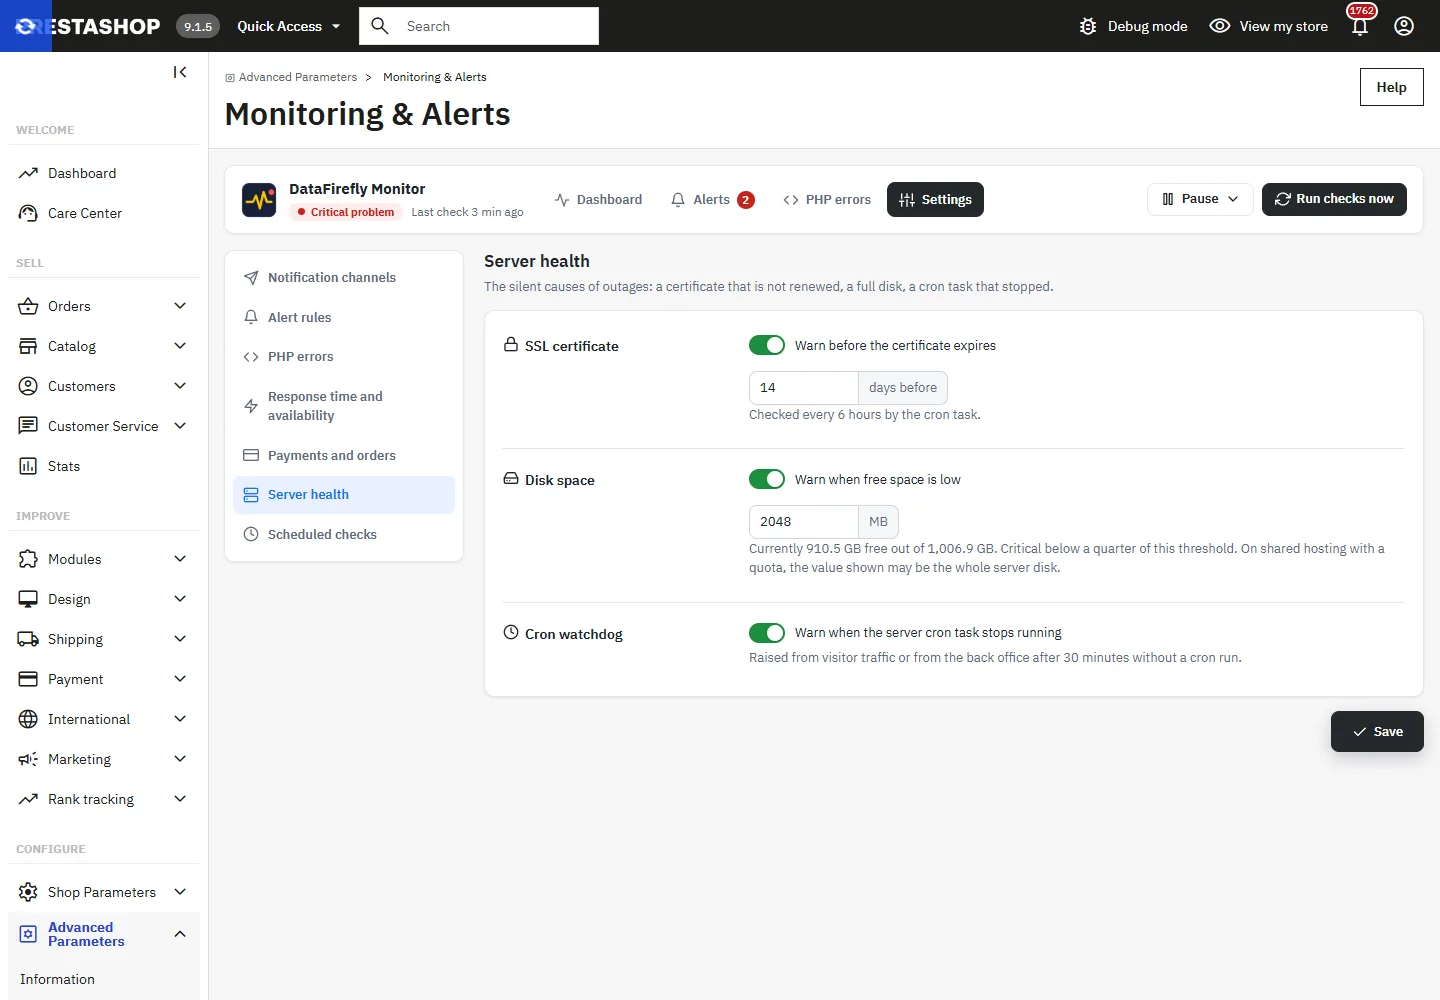
- SSL certificate: read every 6 hours. Warning 14 days before expiry (adjustable), critical at 3 days.
- Disk space: warning below 2048 MB free (adjustable), critical below a quarter of that threshold.
- Cron watchdog: once a server cron has run, an alert is raised after 30 minutes without a run.
Handling alerts
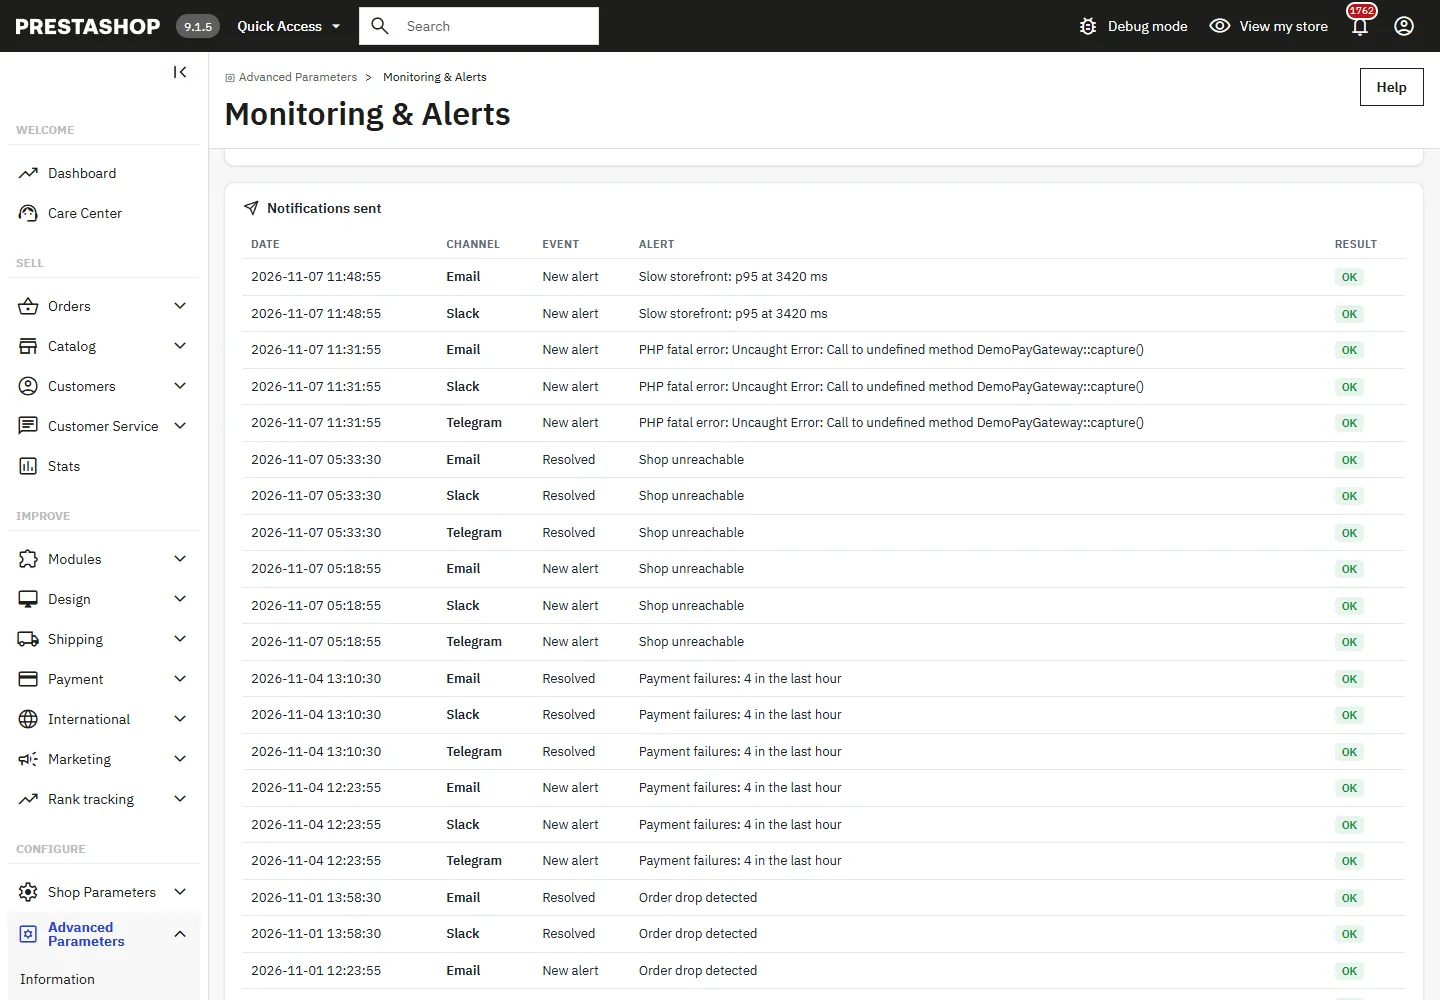
A problem opens a single alert, updated while it lasts. The Alerts tab shows a 30-day summary (alerts, critical alerts, average time to resolve, messages sent), the history with the duration of each incident, and the log of every delivery.
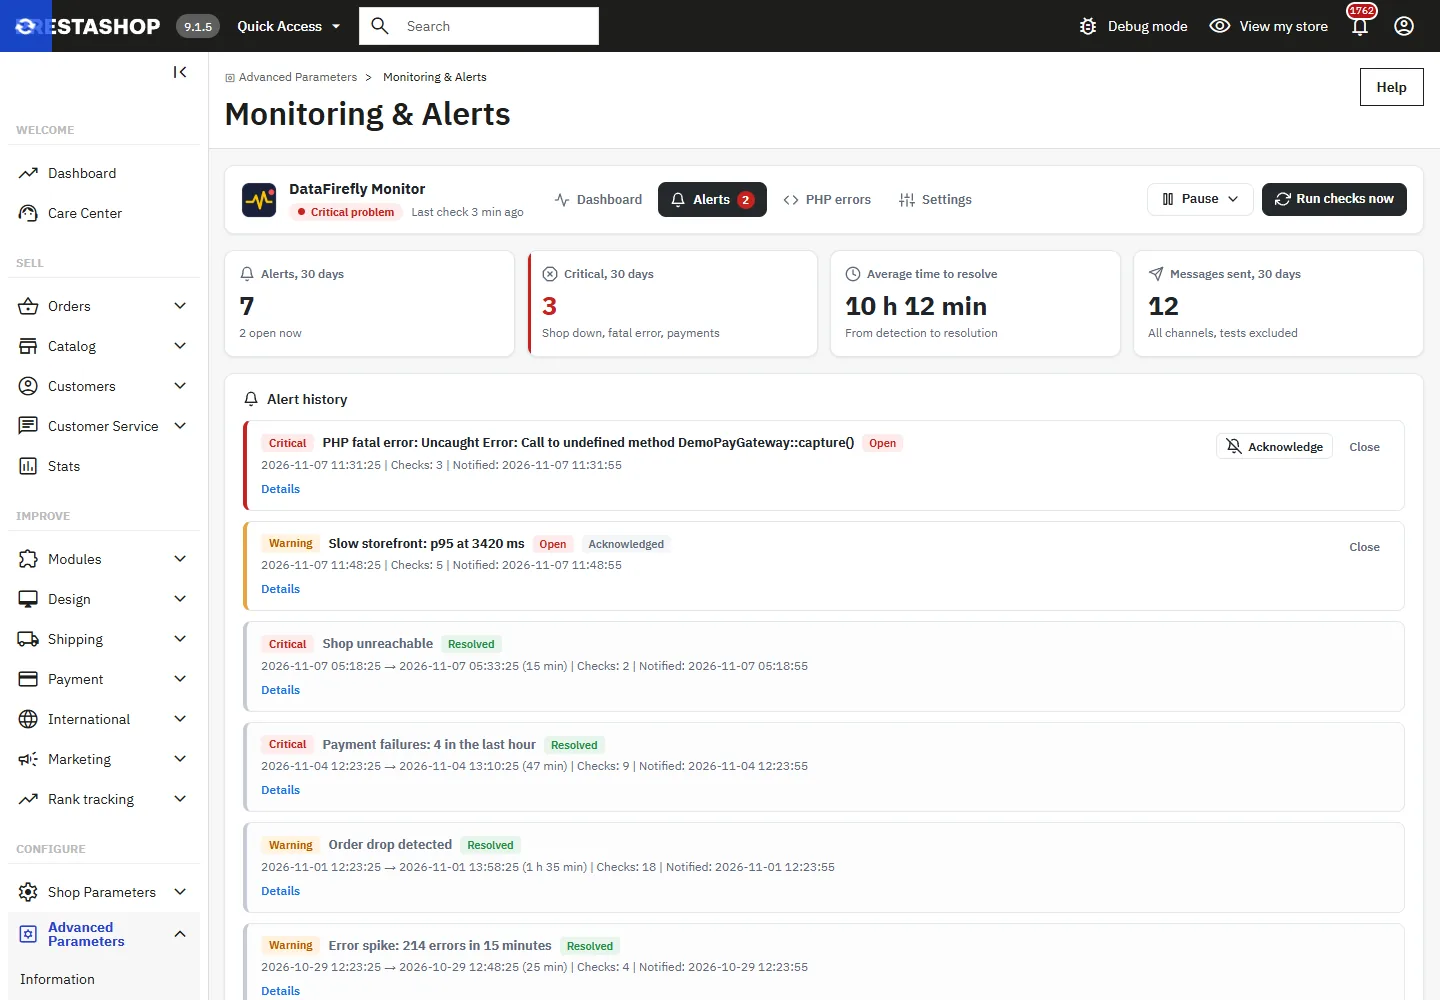
- Acknowledge: stops the reminders. The recovery message is still sent.
- Close: closes the alert. If the problem is still there, a new alert opens at the next check.
Acknowledging from a phone
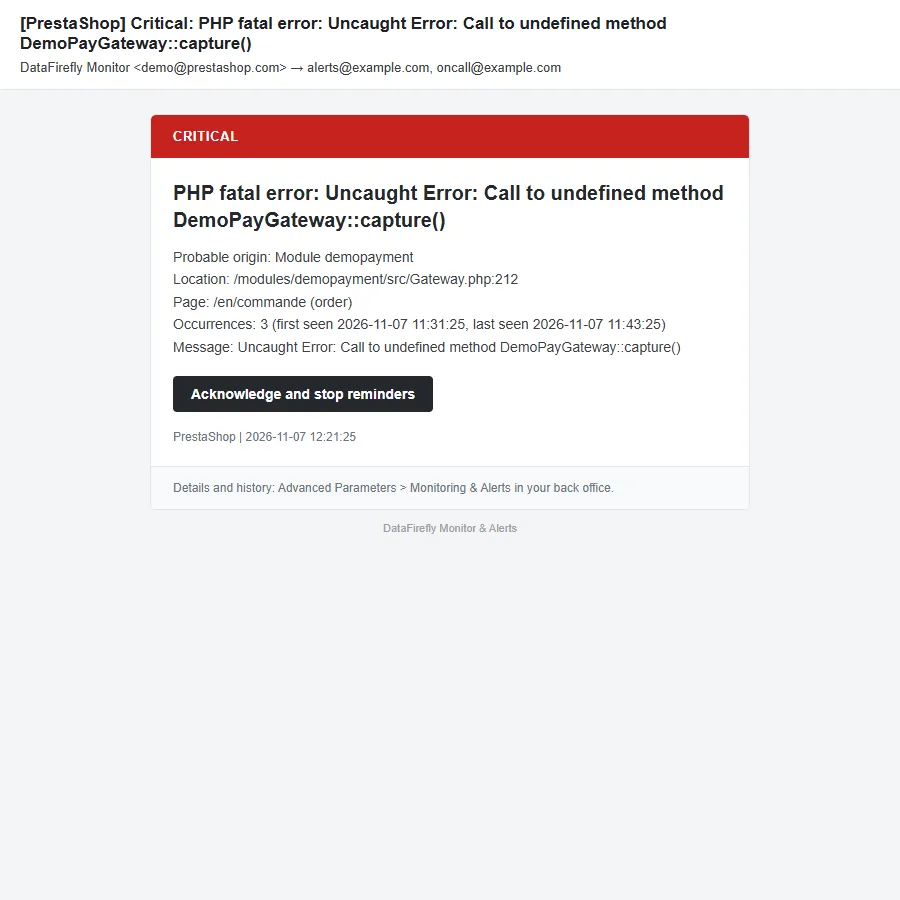
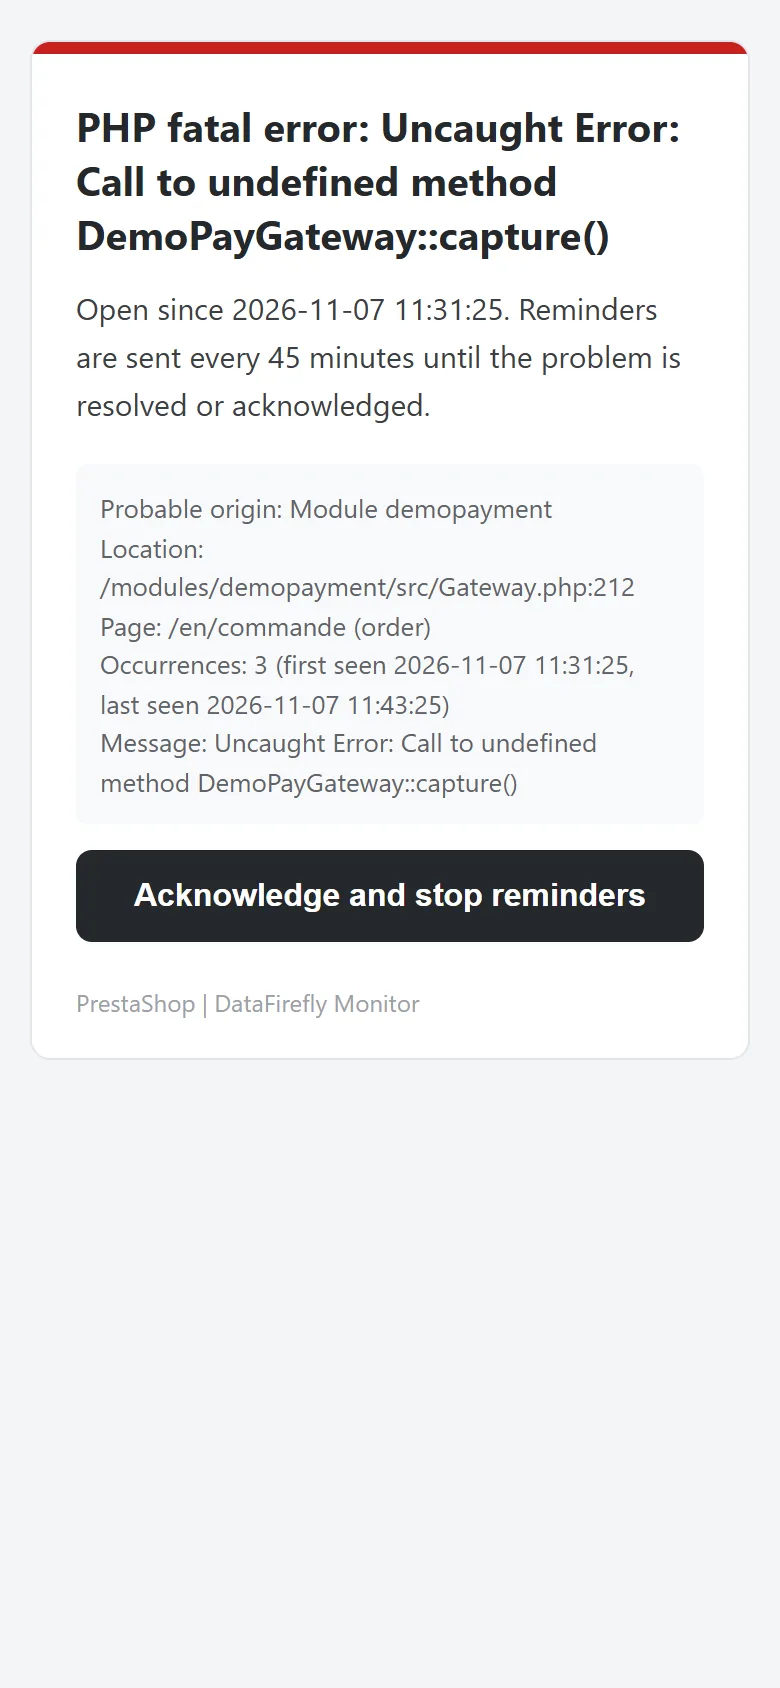
Each alert notification contains an Acknowledge and stop reminders link, signed for that alert. It opens a confirmation page on the shop, designed for phones, and the alert is acknowledged only once you confirm, so mail security scanners that open links cannot acknowledge it for you.
PHP errors page
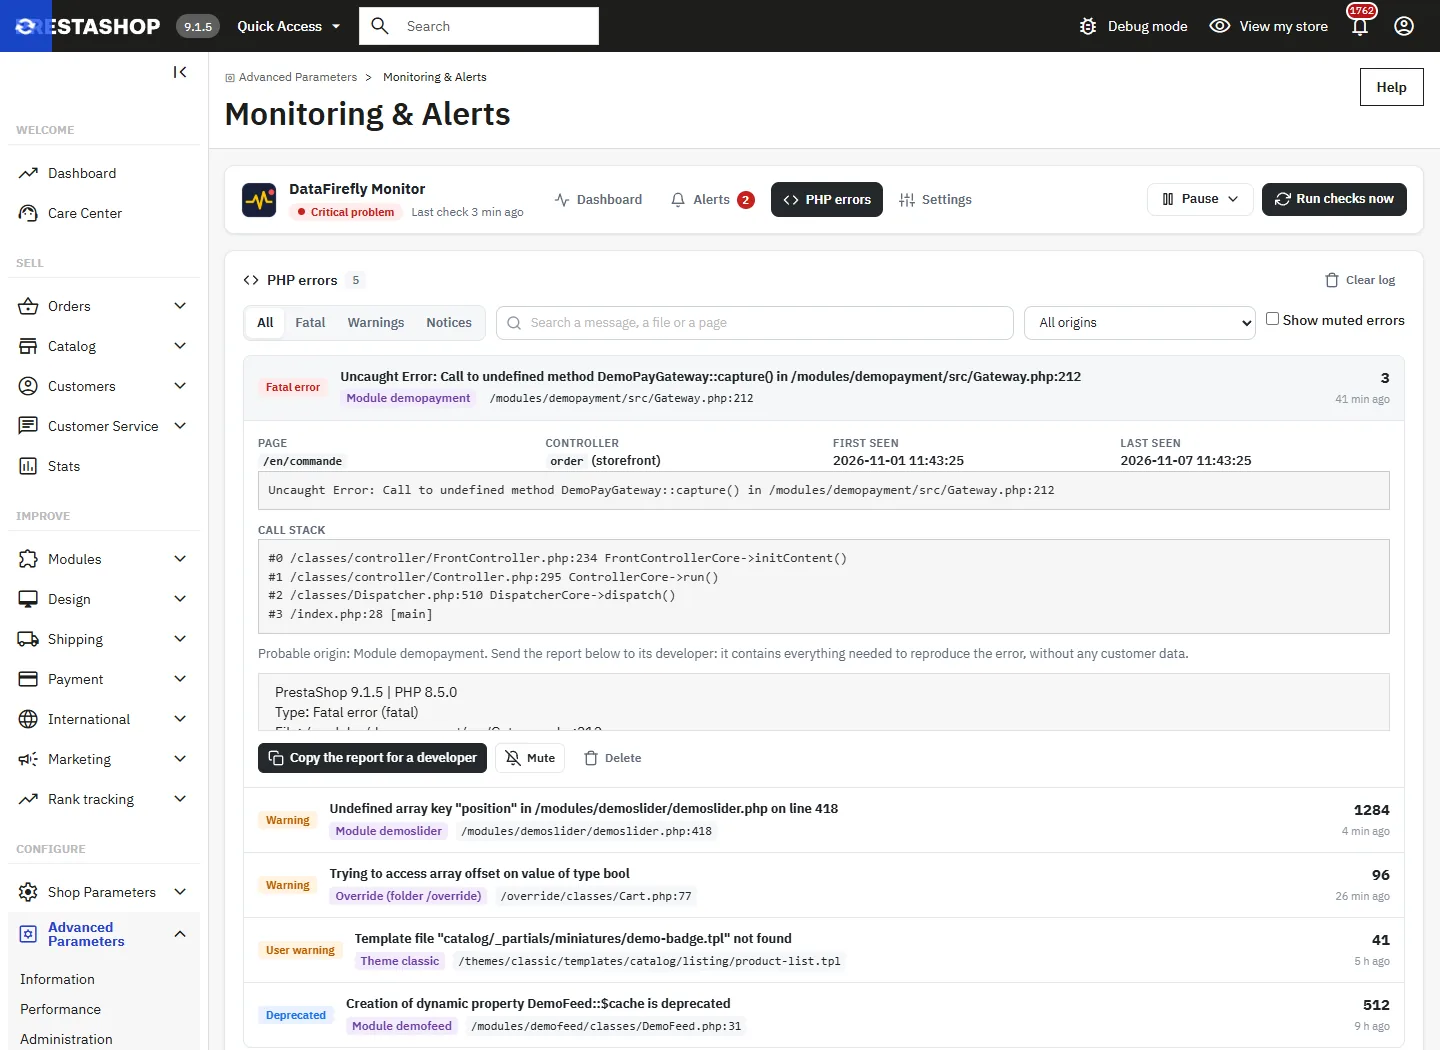
Filter by severity or origin and search a message, a file or a page. An expanded error shows the page, controller, dates, full message and call stack. Copy the report for a developer copies a text with the PrestaShop and PHP versions, file, origin, page, occurrences, message and call stack. Mute keeps counting the error but never alerts on it again.
Permissions
An employee whose profile only has the view permission on Monitoring & Alerts sees every screen in read-only mode: fields are disabled and actions (run, pause, acknowledge, settings) are refused.
Data and privacy
- Page addresses are stored without URL parameters, and the call stack without function arguments.
- The server path and the admin folder name are removed from every stored and sent text.
- Bot tokens and webhook paths are masked in the notification log.
- History is purged after 30 days by default (7 to 365 days), in small batches; closed alerts are kept at least 90 days.
Known limits
- The availability check runs from the server itself: it cannot see an outside network or DNS outage. The external heartbeat covers that case.
- A fatal error raised before modules are loaded is not caught by the error handler; the availability check and the 5xx rate report it.
- Symfony back-office pages do not go through the hook used to capture back-office errors.
- Checkout conversion relies on the
displayPaymentTophook. If your one-page checkout does not call it, turn this check off: the order drop check still applies.
Troubleshooting
The email test fails
Check the configuration in Advanced Parameters > E-mail and send a test from that page. The exact error is shown after the test and in the Alerts tab.
The home page is shown as down although the shop works
The server probably cannot reach its own public address. Fill in Connection address (for instance 127.0.0.1:80) and click Save and test the pages now.
“No server cron detected” stays displayed
Only the CLI cron or the cron URL count. Run the command by hand over SSH: it prints a JSON report. If it fails, check the PHP CLI path with your host.
The webhook test answers “address refused”
The URL points to the private network or to the server itself. Use a public address, or turn on Allow a webhook on the private network if your tool is hosted on your own network.